cartagen.heatmap#
- heatmap(points, cell_size, radius, column=None, method='quartic', clip=None)#
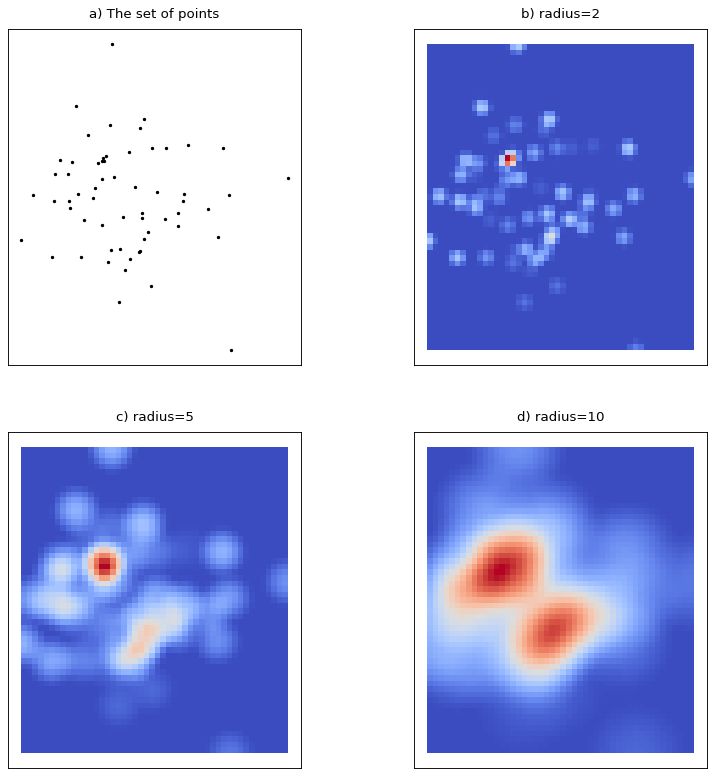
Create a heatmap using the kernel density estimation technique (KDE).
This function performs a spatial smoothing with the kernel density estimation technique (KDE), also known as heatmap. More information about heatmaps can be found in Wilkinson & Friendly. [1]
For more information about KDE, here is a link to the related Wikipedia article. This code is partially based on this script.
- Parameters:
points (
GeoDataFrameofPoint) – The points used to calculates density.cell_size (
int) – The size of the cell of the grid containing density values. Smaller size means smoother result, but also higher computation time.radius (
intorstr) – The radius used for the density calculation in each grid cells. For each centroid of grid cell, all the points within the radius are taken in account for density calculation. Higher radius means more generalized results. You can also specify a column name representing a variable radius. This allows the heat map’s accuracy to be adapted to the local point density.column (
str, optional) – Name of the column of the point to use to weight the density value.method (
str, optional) – Name of the smoothing method that calculates the density value of each point within the radius. Each method impacts the way distance is important in the density calculation. Possible values: ‘quartic’, ‘epanechnikov’, ‘gaussian’, ‘uniform’, ‘triangular’clip (
GeoDataFrameofPolygon, optional) – Polygons to clip the resulting heatmap grid. Be aware that it can return MultiPolygon.
- Returns:
grid (
GeoDataFrameofPolygon) – The grid containing the values of density
References